Mid-term post.
Conquered one more phase. :) I have successfully completed GSoC mid-term evaluation!
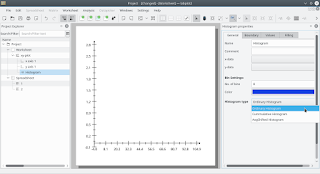
My midterm evaluation target was to create a static histogram in Labplot with an option to add new histogram among the given types and set visible advanced settings.
I have added a new histogram dock widget containing the required settings options like selecting number of bins or type of histogram or the color of the plot and much more to be added eventually like settings of the boundary, it's color, style,etc.
My next task is to draw the histogram for any (static and dynamic) data set. It's time to implement everything that I have discussed and read about GSL libraries and QPainter.
Working on a large project like LabPlot is really engaging. A lot of work to be done in the coming up month. :)

