Winding up GSoC.
Time flies, truly. With the end of this month comes the end of such an amazing programme
"Google Summer of Code 2016".
As planned earlier I have successfully implemented GSL library to construct histogram for both static as well as dynamic input values.

Now, a user can
"Google Summer of Code 2016".
As planned earlier I have successfully implemented GSL library to construct histogram for both static as well as dynamic input values.
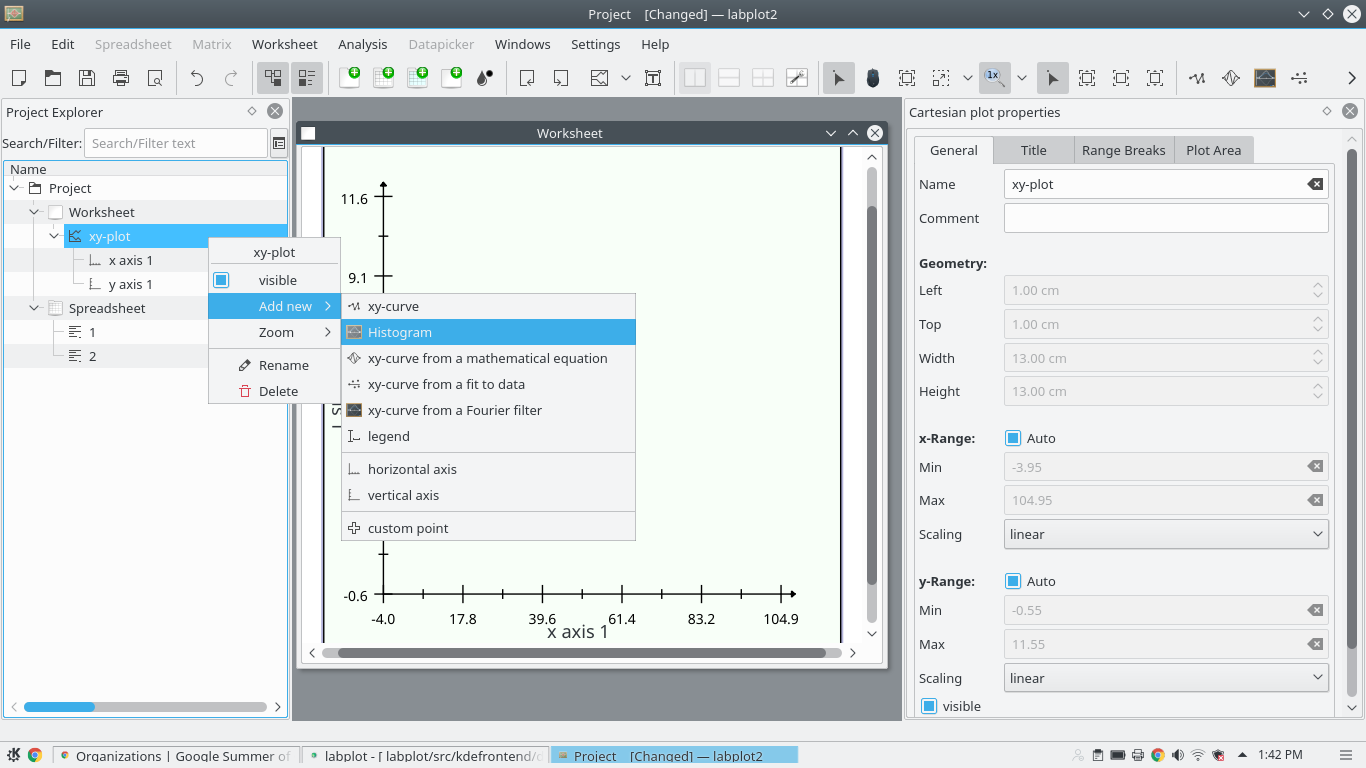

Now, a user can
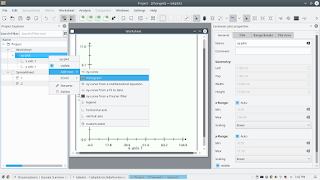
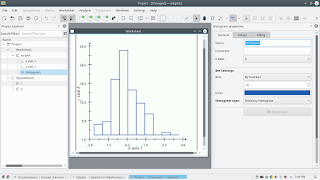
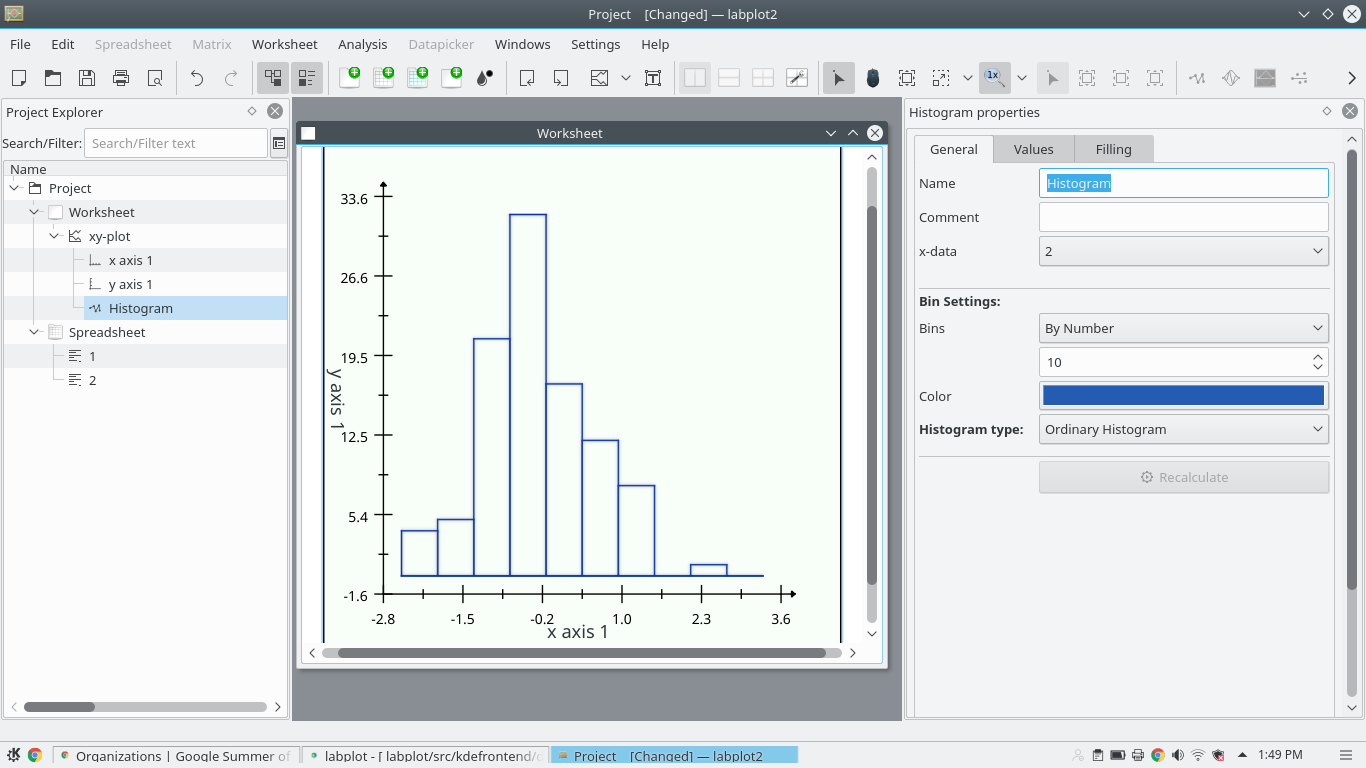
- Draw different types of histogram for a given set of values.
- Change the method of selecting the bin value.
- Change background and filling of histogram graph.
- Alter the properties of histogram graph scaling (auto-scale. color, pattern).
- Mark the magnitude of bin ( individual or cumulative).
- Draw/plot more than one curve on same worksheet to enhance the analytic study/comparison.
Though the programme has come to an end, I will continue contributing in KDE community and LabPlot. I would like to thank all my mentors in Labplot.
Working demo: https://www.youtube.com/watch?v=XHjYvmInXY
Working demo: https://www.youtube.com/watch?v=XHjYvmInXY
Thanks for reading :)